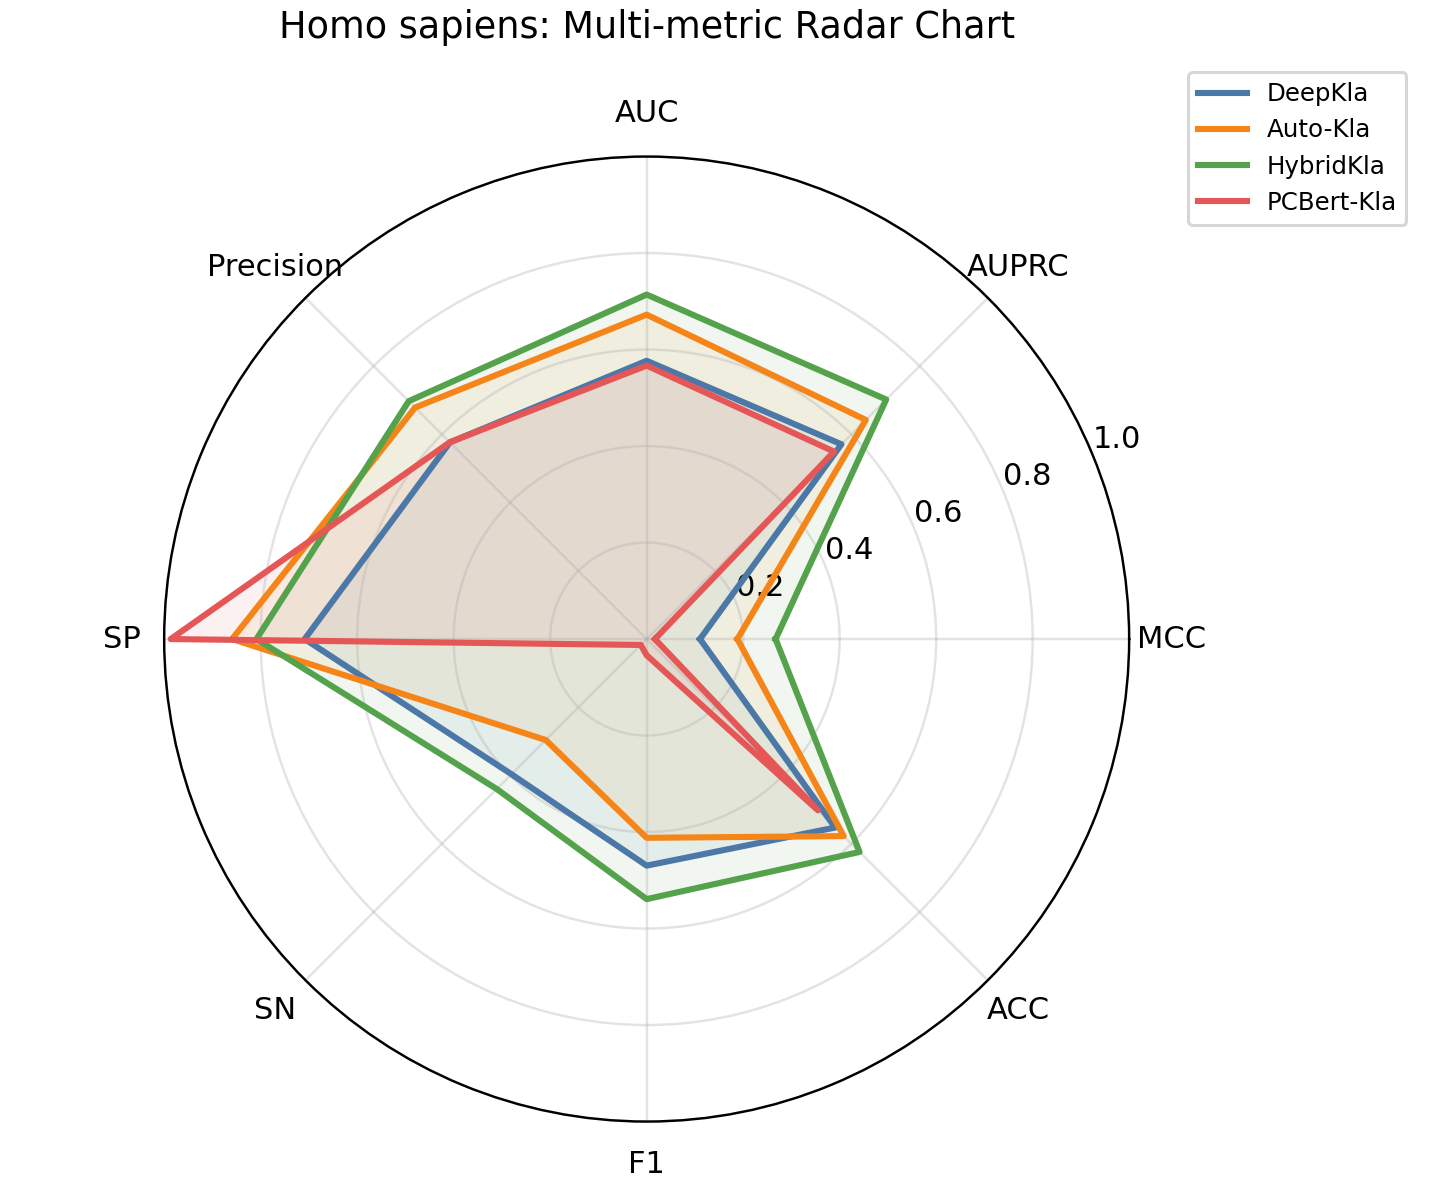
Benchmark Test of Kla Site Prediction Model
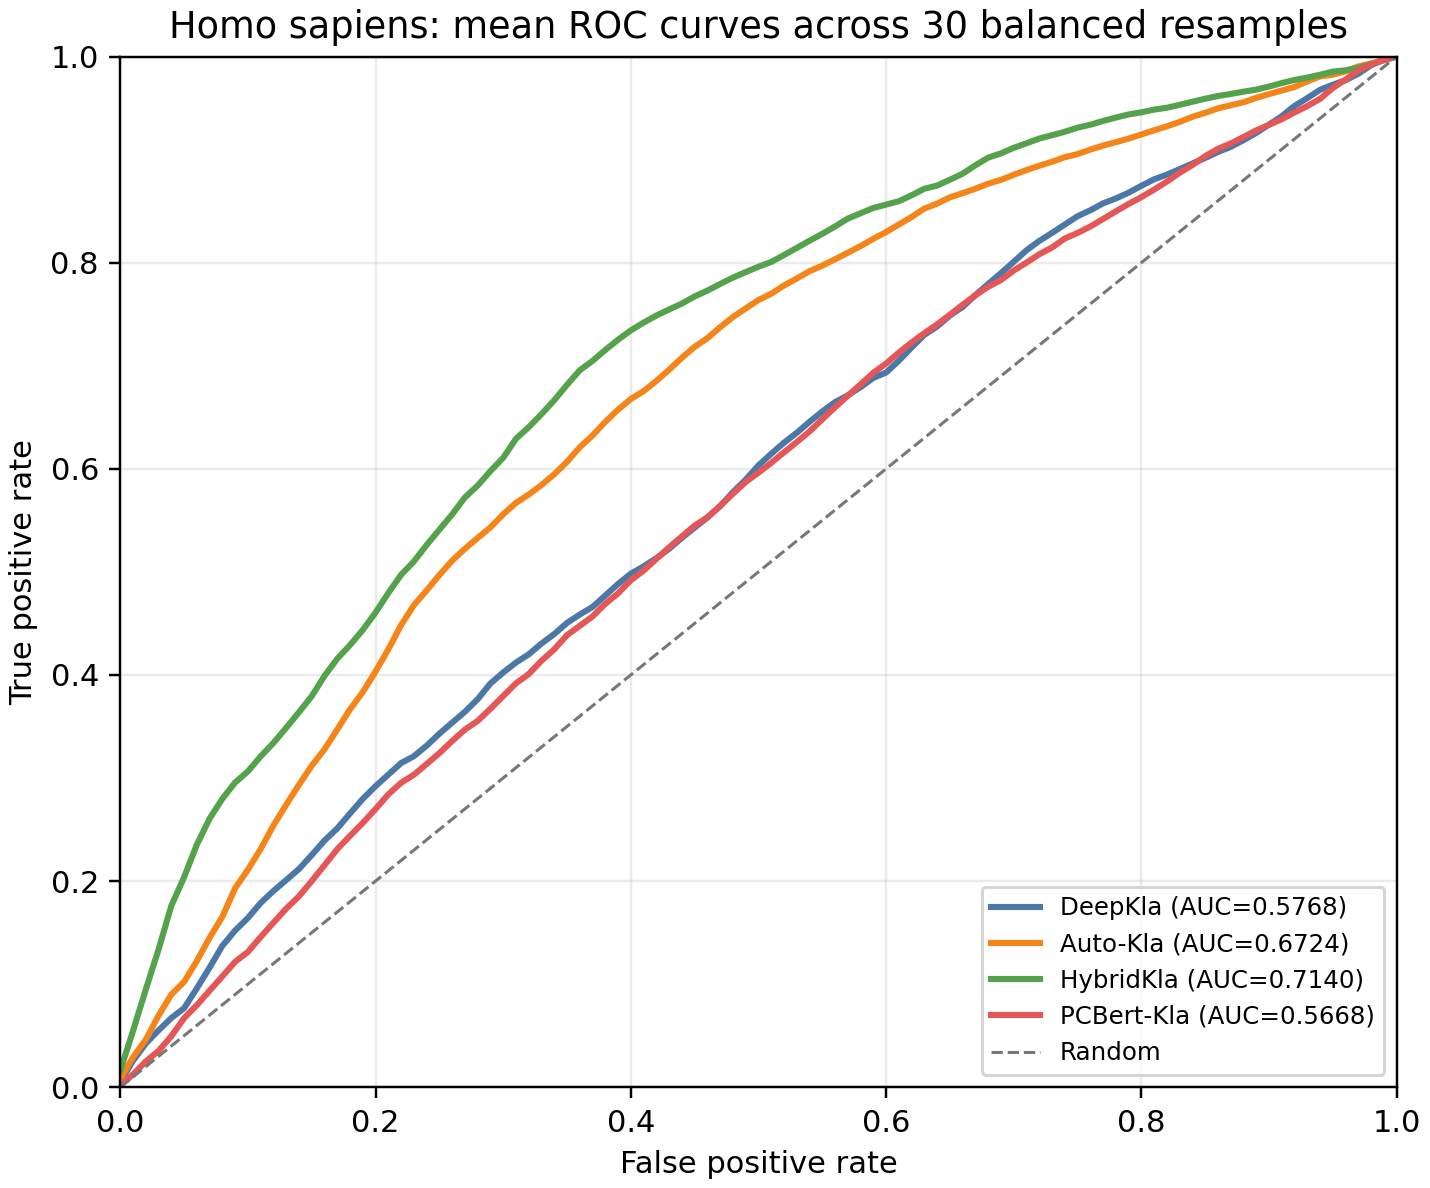
For a shared comparison across all four models, each positive is paired with one putative/unlabeled negative in 30 deterministic 1:1 resamples. Displayed values are the 30-resample means. Sequences homologous to any model training set were excluded at 70% identity and at least 80% bidirectional coverage. Threshold-dependent metrics use a fixed probability threshold of 0.5. Sensitivity analyses using 1:5, 1:10, and all putative-negative settings are available in the public benchmark directory.
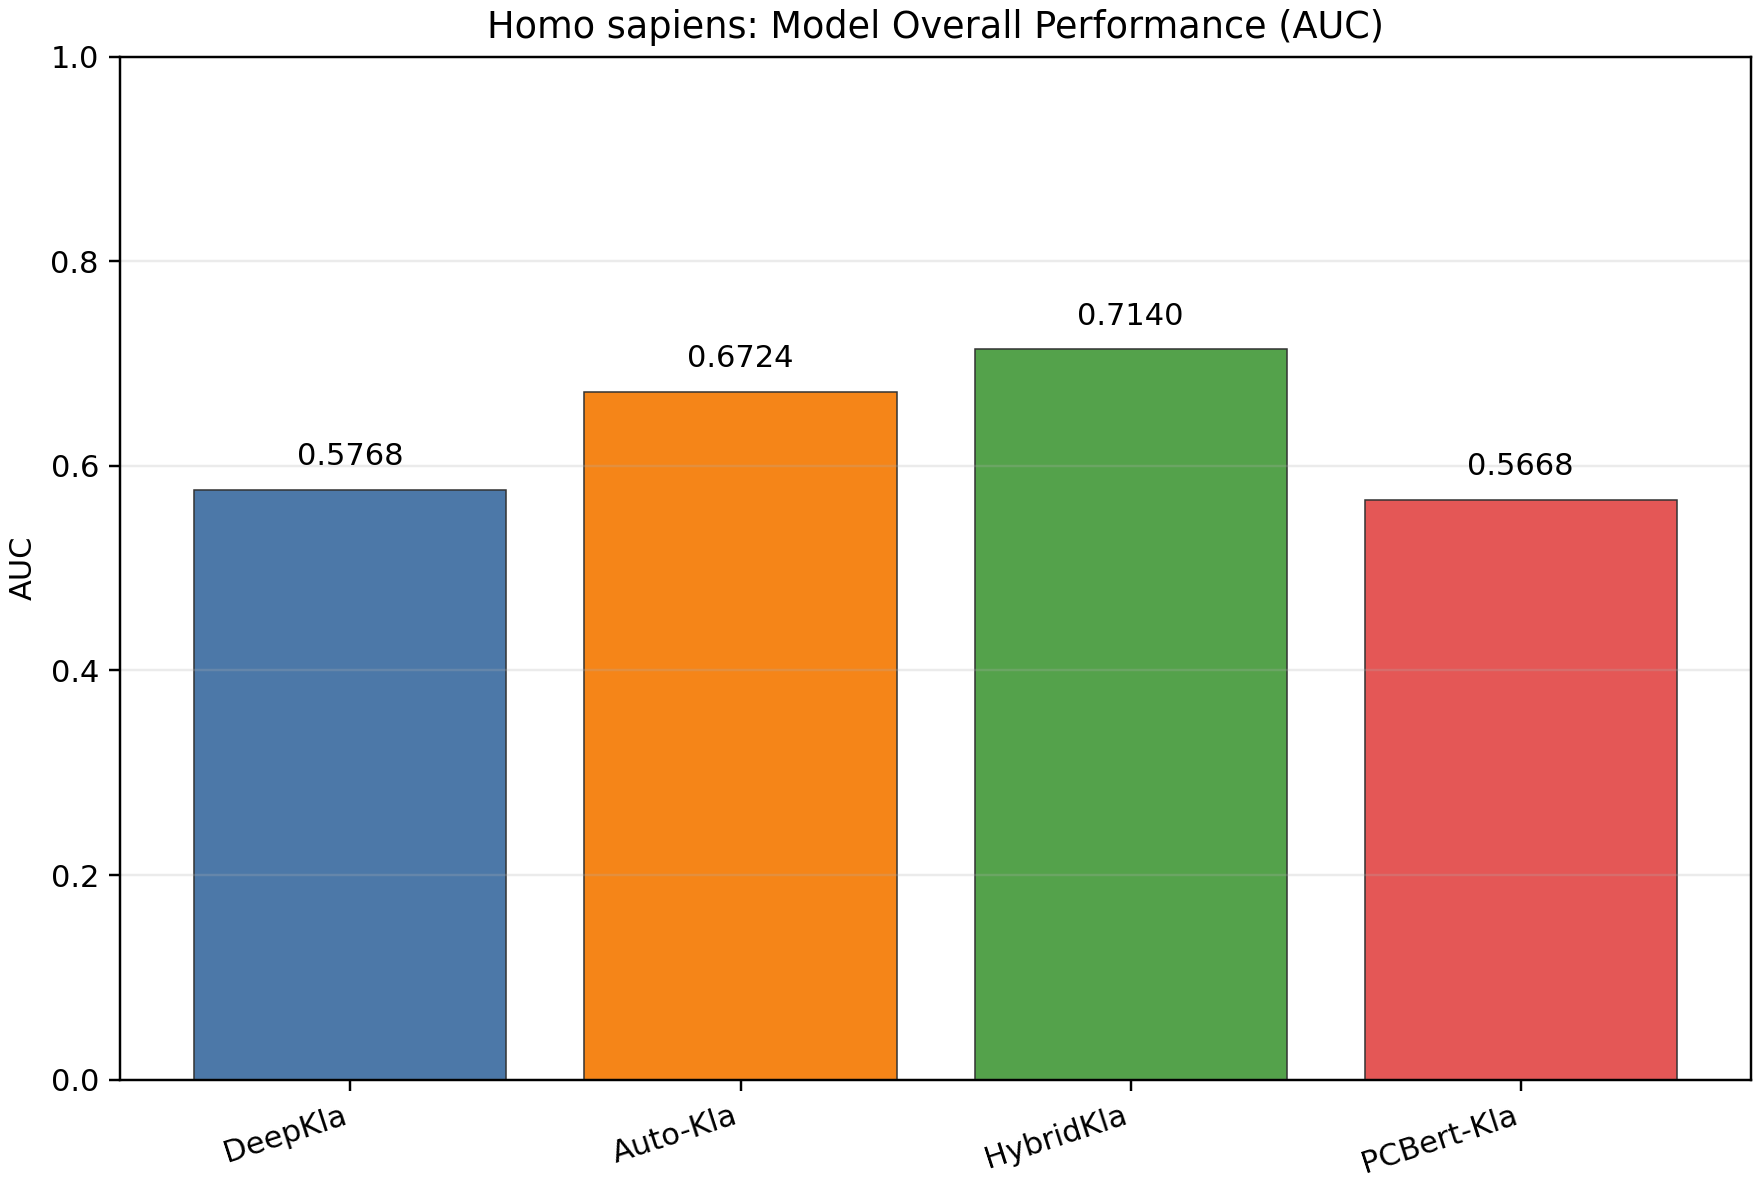
Model Overall Performance (AUC)
Model Performance Metrics Comparison
All metrics are summarized across 30 matched 1:1 resamples. MCC, SN, SP, precision, F1 and ACC use a fixed threshold of 0.5.
| Model Name | AUC | AUPRC | MCC | ACC | F1 | SN | SP | Precision |
|---|---|---|---|---|---|---|---|---|
| DeepKla | 0.5768 | 0.5709 | 0.1105 | 0.5525 | 0.4696 | 0.3962 | 0.7087 | 0.5766 |
| Auto-Kla | 0.6724 | 0.6423 | 0.1881 | 0.5776 | 0.4119 | 0.2958 | 0.8593 | 0.6786 |
| HybridKla | 0.7140 | 0.7021 | 0.2672 | 0.6240 | 0.5390 | 0.4394 | 0.8087 | 0.6973 |
| PCBert-Kla | 0.5668 | 0.5493 | 0.0171 | 0.5019 | 0.0336 | 0.0173 | 0.9864 | 0.5769 |
ROC Curve Comparison
Multi-metric Radar Chart